This post is a continuation of Telling the Sharon Hills Story from October 17, 2023
By Camryn Brent, Huron Pines AmeriCorps member
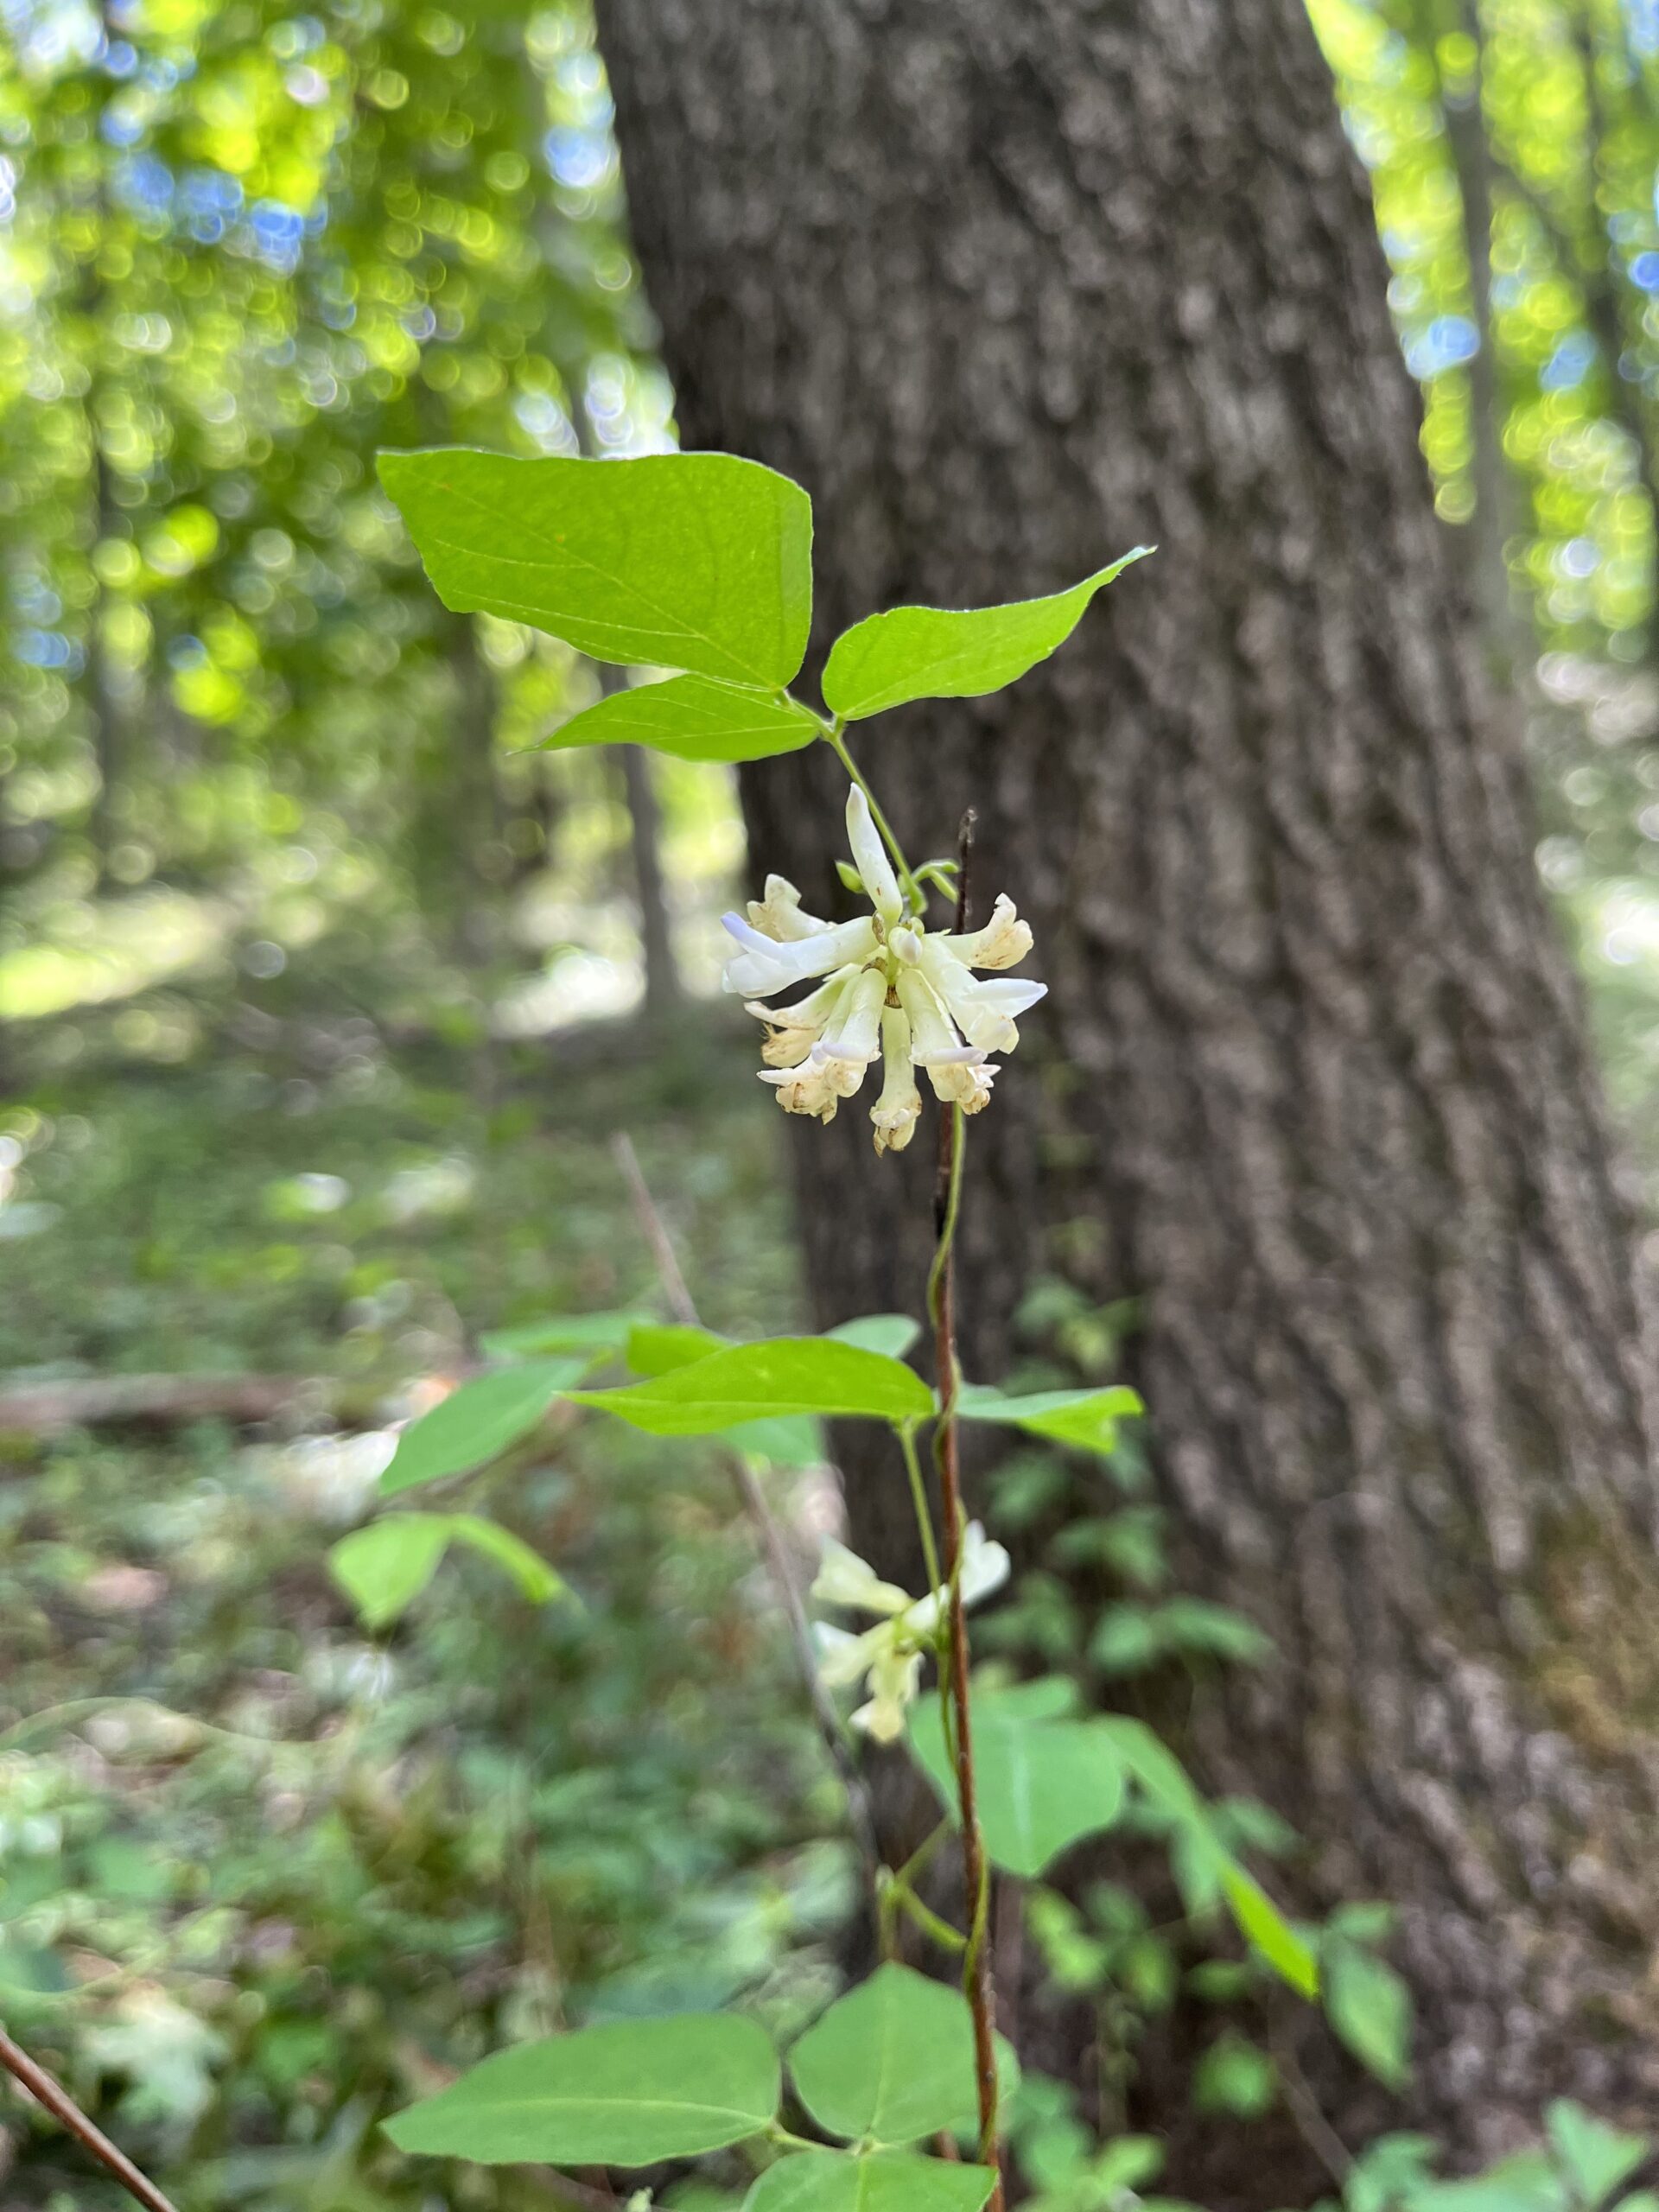
Hog peanut flowering
Knowing the names of plant species at Sharon Hills Preserve as a result of the plant survey I conducted this year has deepened both my connection to the Preserve and my ability to learn what it needs from us as land stewards. As I sit in the office though, with only a week left of my service, I feel somewhat sad. Maybe it’s because I’ll miss the plants as they go dormant or maybe it’s because I know I will be visiting Sharon Hills a lot less often now. But one thing comforting me is knowing that my plant survey is helping Legacy update their management objectives to best allow the native communities at Sharon Hills to thrive.
Ranking plant species to paint a clearer picture
To my delight, conducting the plant survey was only the first part of my project with Legacy. The next part was analyzing the data collected to inform updates to the larger Sharon Hills management plan. But what kind of data does a list of plant names provide?
First, I had to assign a value to each plant by assigning a number or ranking. As someone who is not a numbers gal, I was not too enthused when I first learned what is known as the Michigan Floristic Quality Assessment (FQA).
The FQA was developed to identify areas of floristic significance. With this information, land managers can prioritize specific areas in order to maintain diversity of native plant species and the natural communities they inhabit. Under this system, a Coefficient of Conservatism value (C-value) is assigned to each species. This value can range from 0 – 10.
The number represents the tolerance of a particular plant species to habitat degradation. For example, a plant with a C-value of 0 would be expected to be found nearly anywhere, independent of site’s level of disturbance. Meanwhile, a plant with a coefficient of 10 is almost always restricted to a remnant community (one that is relatively unaltered from its condition prior to European colonization).
Land stewards try to prioritize areas of “high quality”, which are typically areas where species with high C-values are present. [For more information on Michigan’s FQA click here]
It’s important to understand the mind frame of a land manager using terms such as “high quality”, “disturbance”, and “natural”. When describing “disturbance”, they often mean how much a site varies from its “natural state”. (The baseline for what is considered “natural state” can also vary, and in this instance, they use information gathered on what natural communities would have looked like prior to European colonization.) Often times areas designated as high quality can also be characterized by a lack of disturbance. The term “natural” is basically a blanket term that means nothing and everything all at once. When thinking about the factors that contributed to the pre-European settlement plant communities, it is imperative to consider the indigenous people that had managed the land for thousands of years. This makes the term “natural” a bit misleading!
In order to find a C-value for each plant species identified in my survey, I used the online herbarium available through Michigan Flora which provides a C-value for each plant.
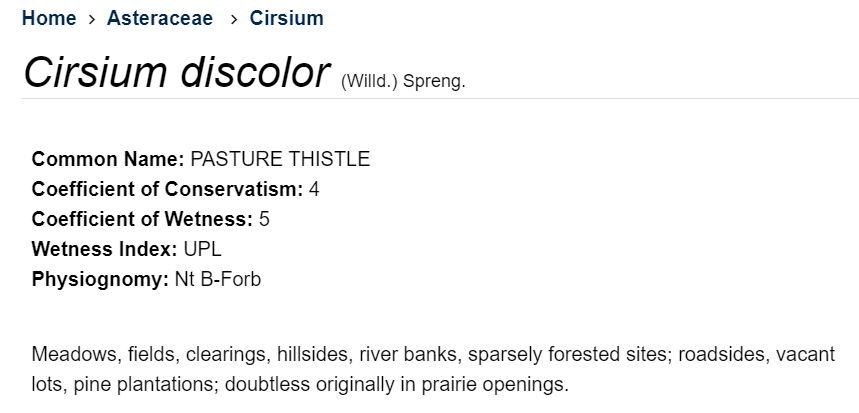
Screenshot of pasture thistle from www.michiganflora.net
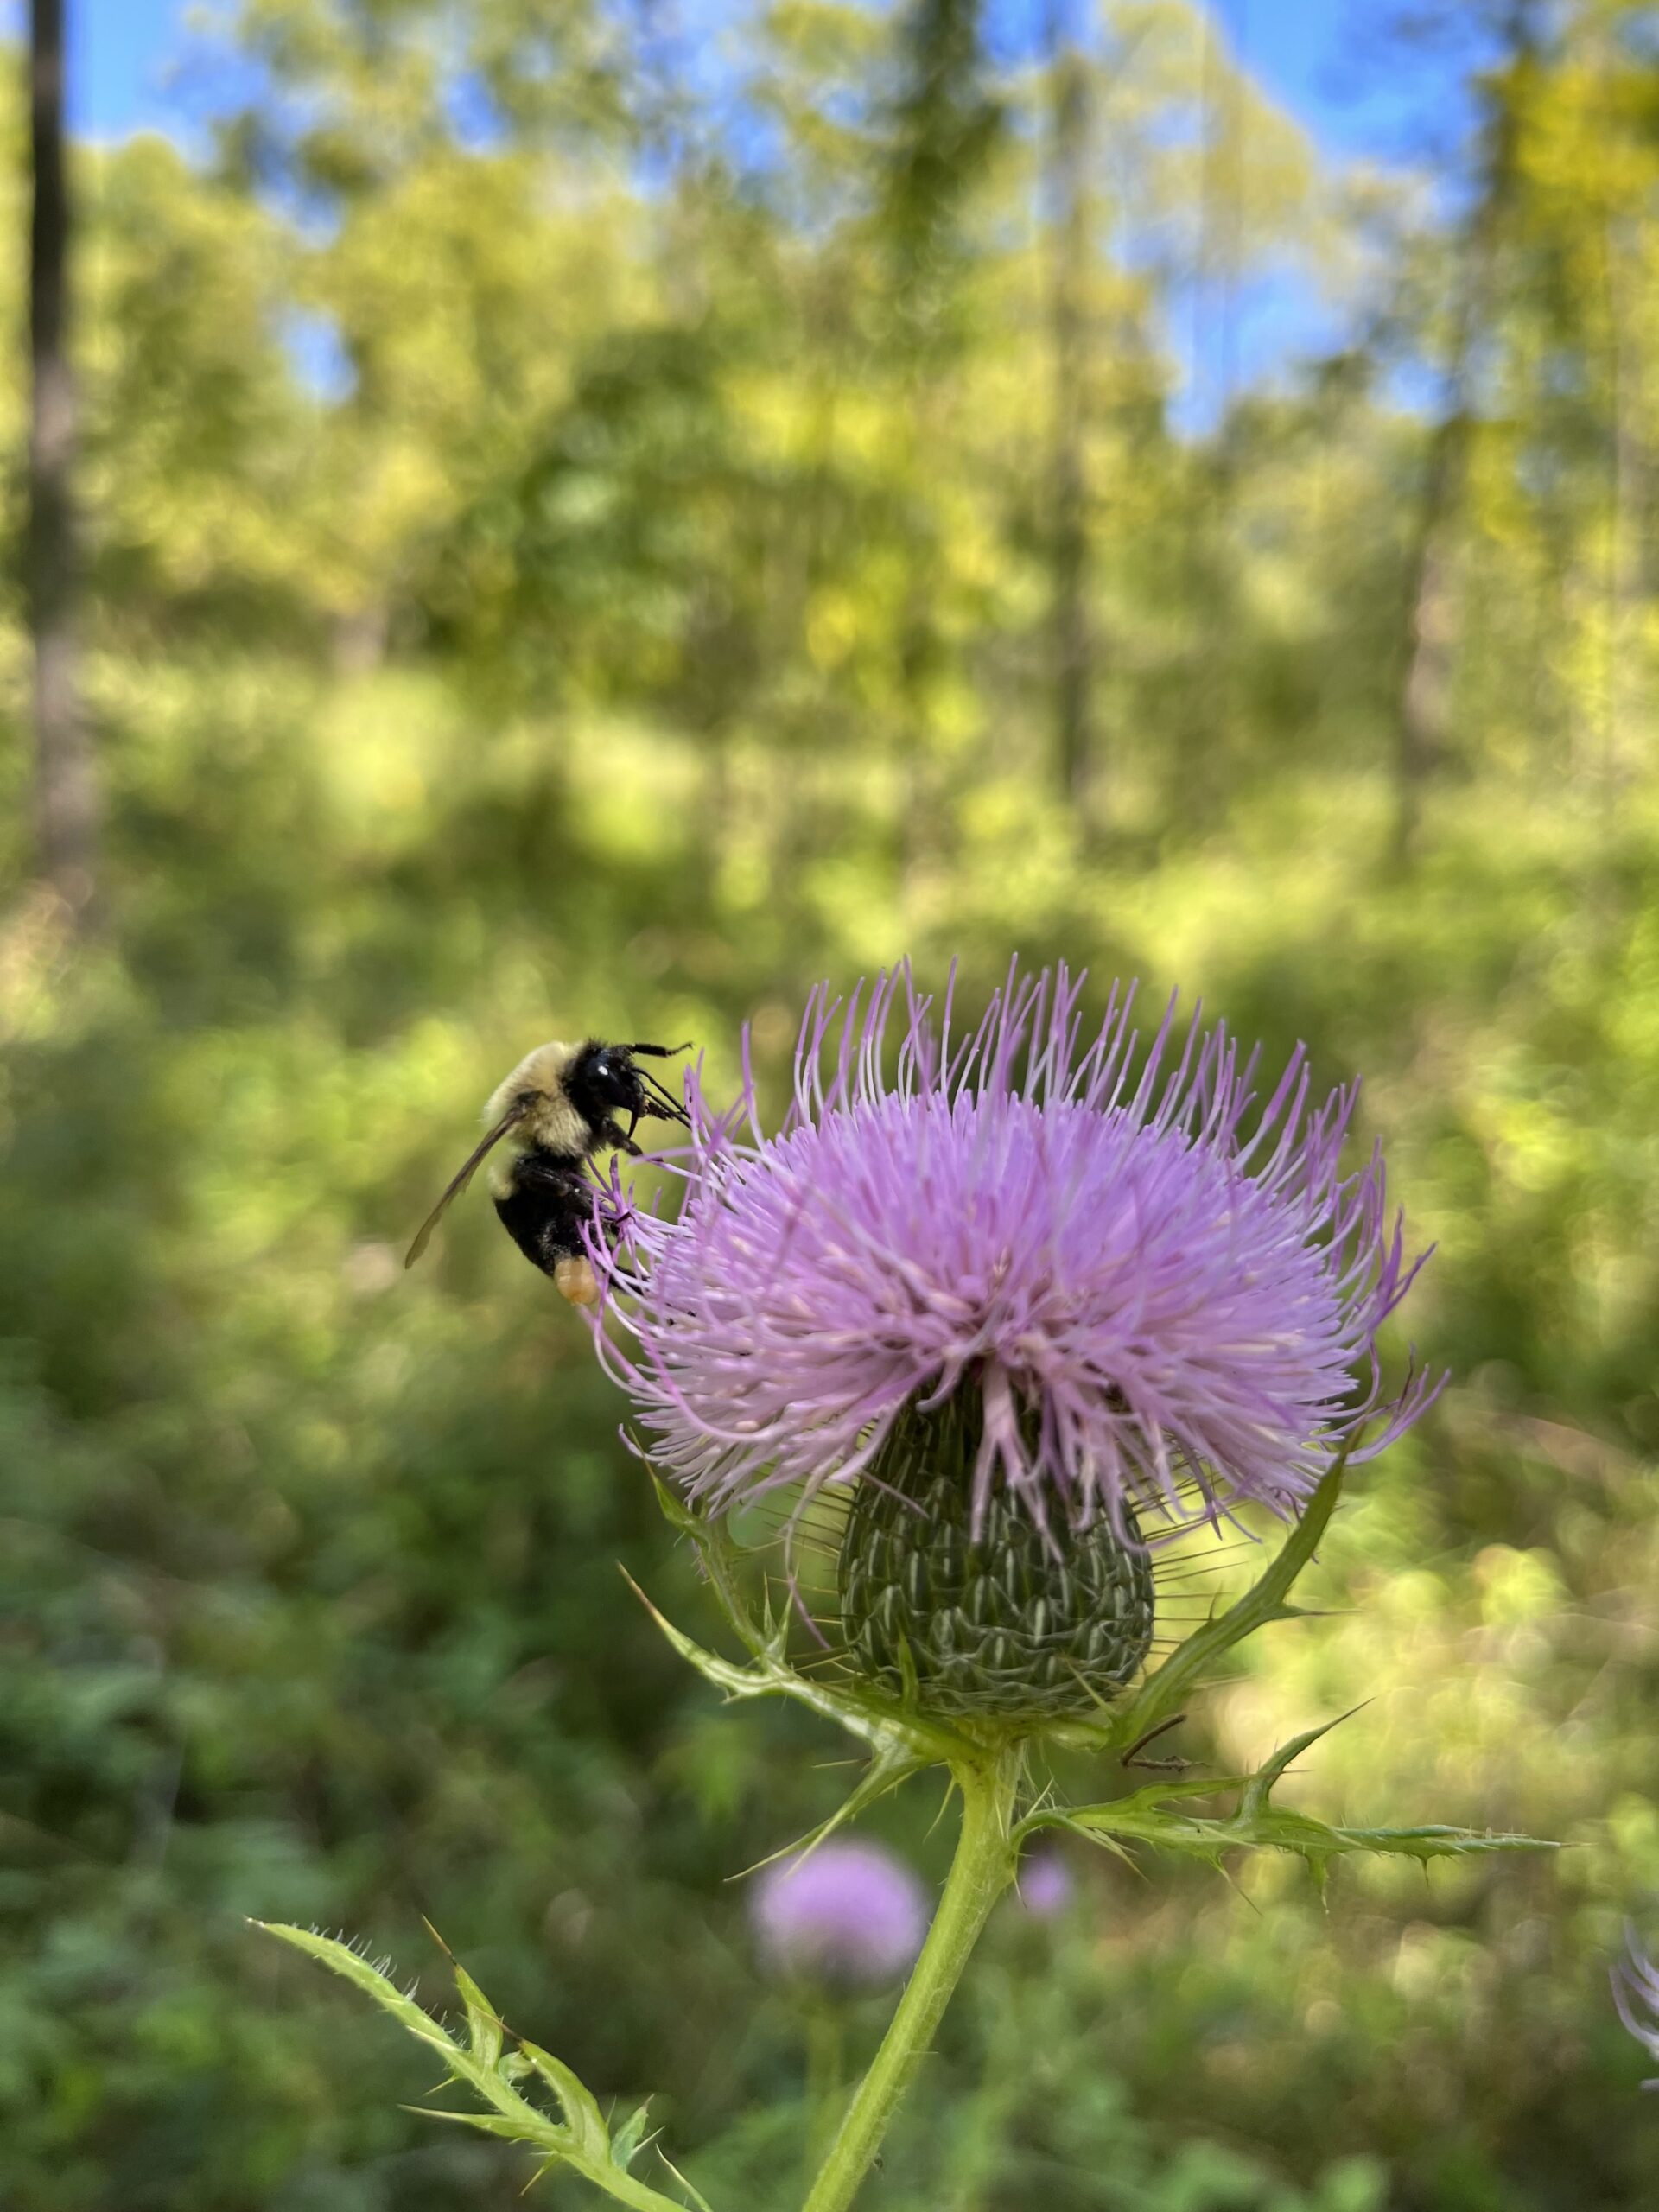
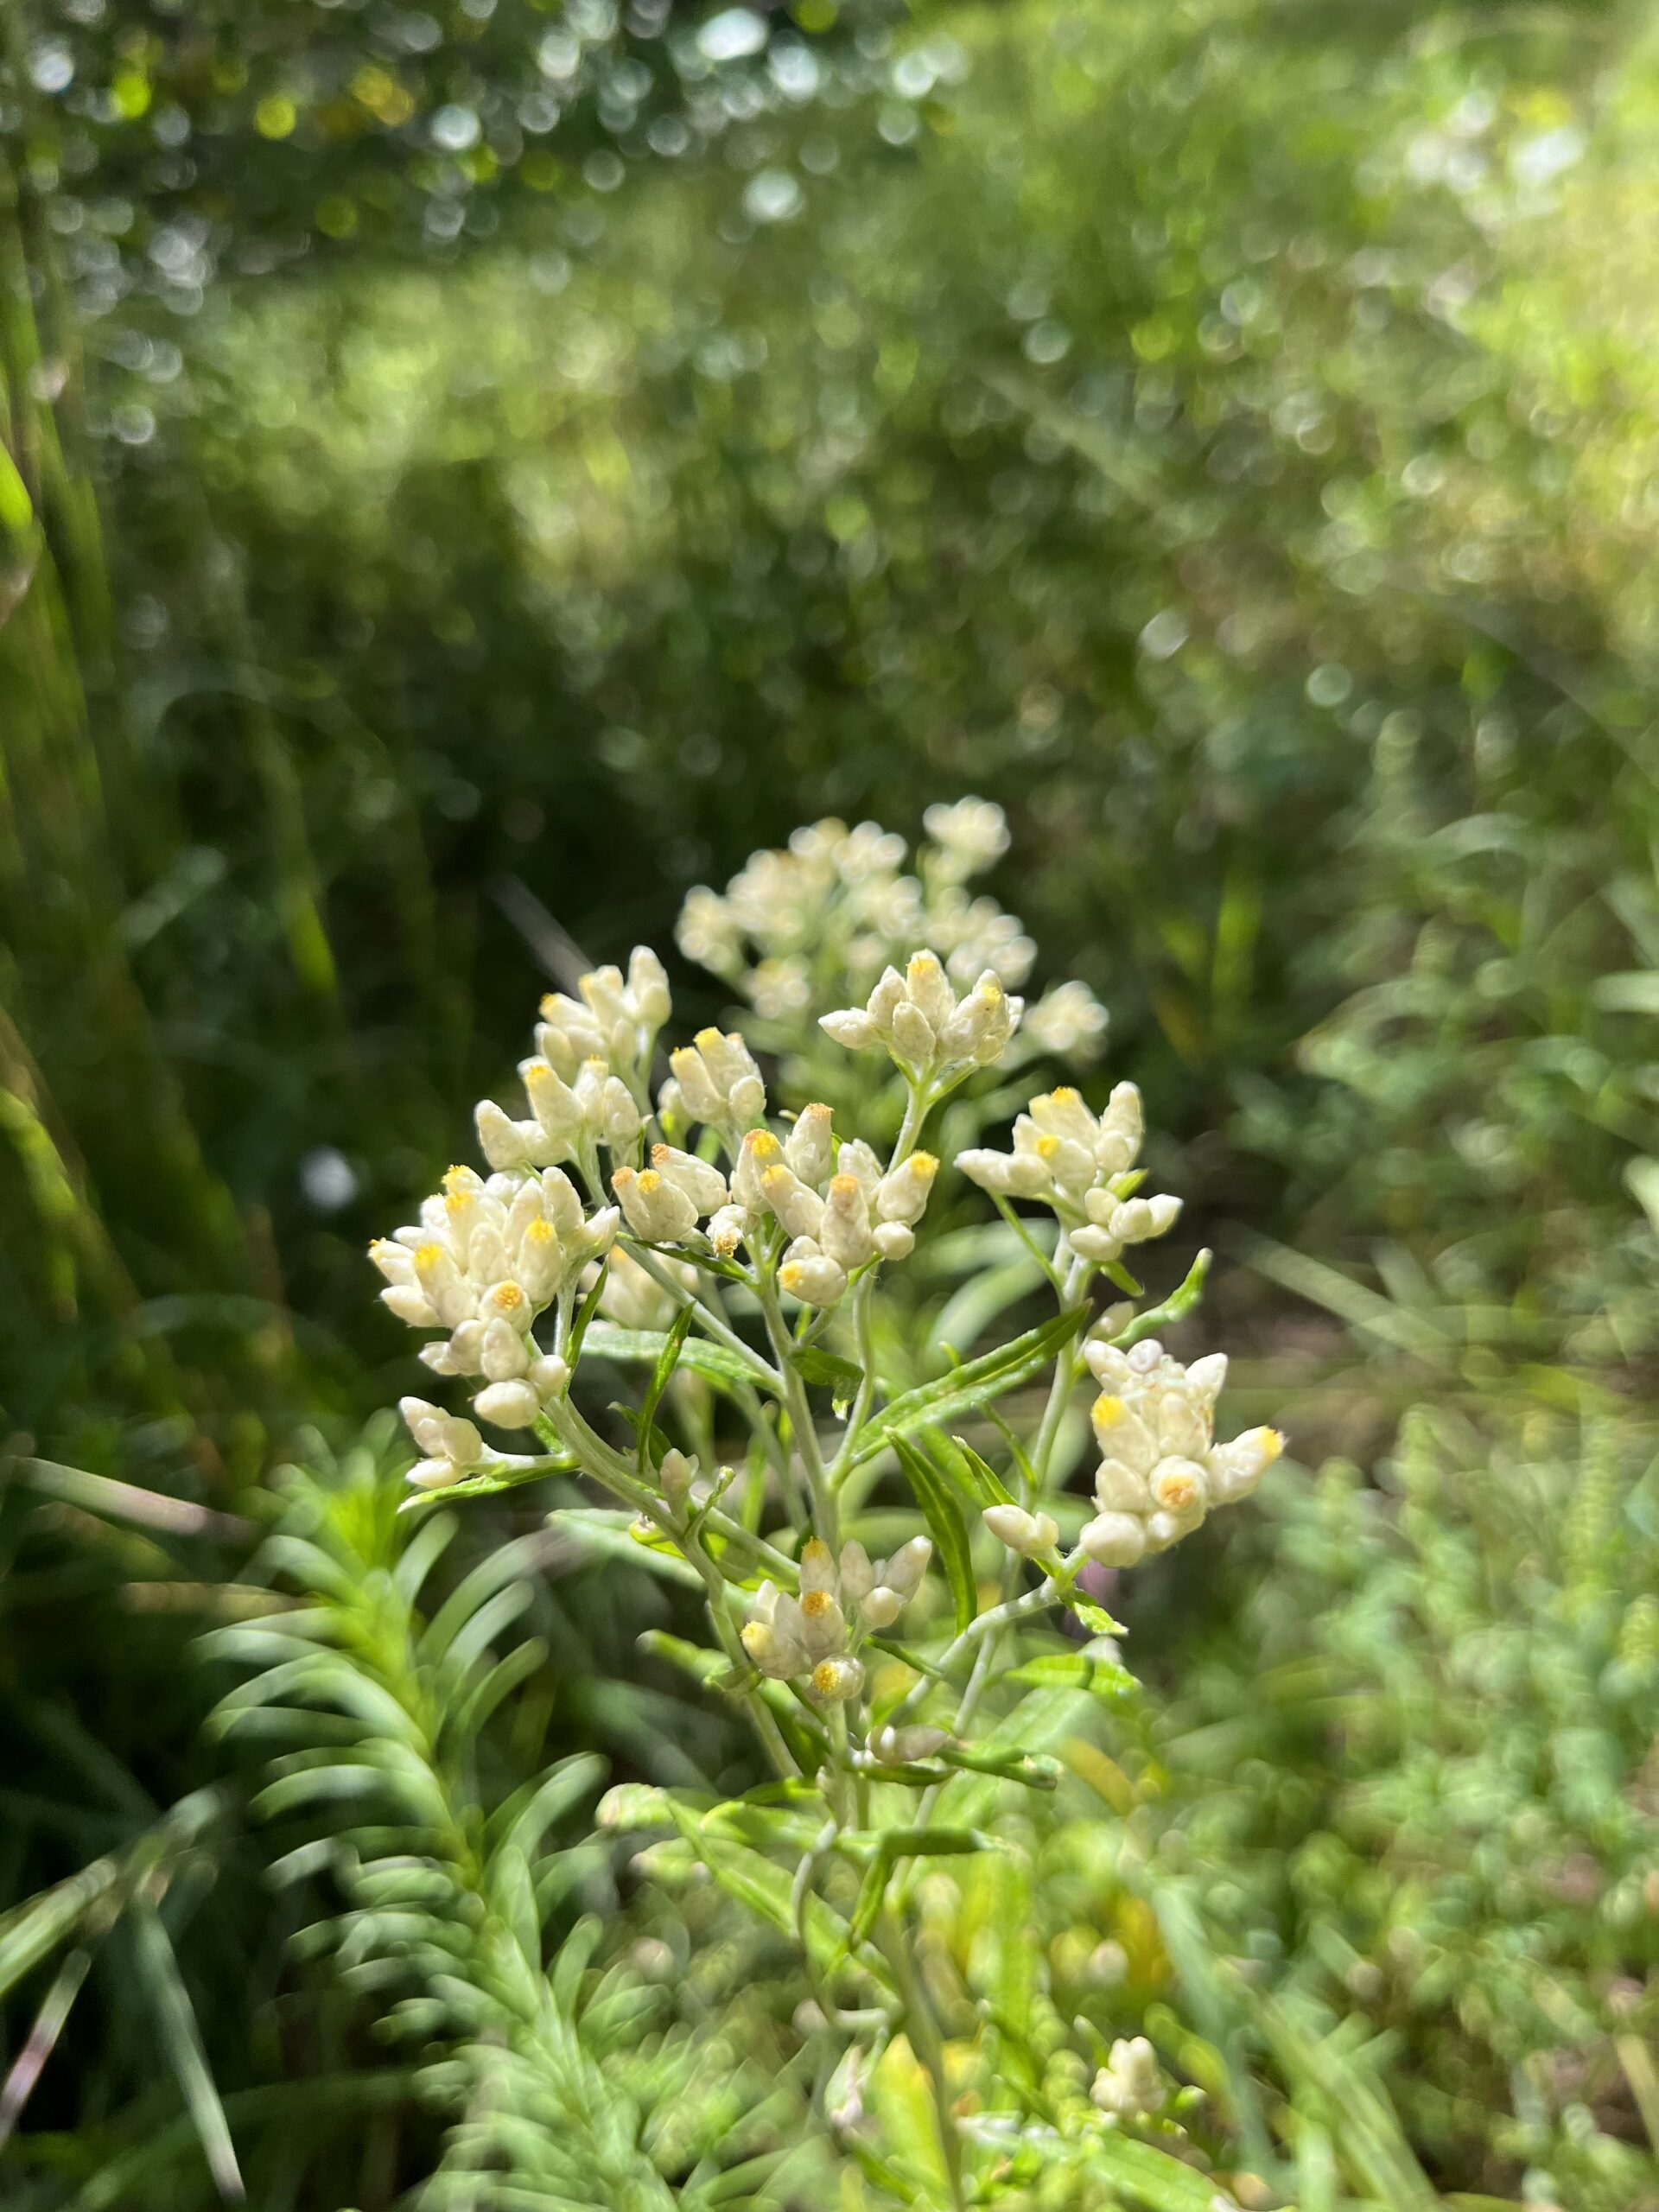
It’s important to note that the C-values only focus on how sensitive a plant species is to disturbance. The number does not equate with a plant’s worth in the ecosystem! For example, pasture thistle has a C-value of 4, placing it on the lower end of the conservatism scale. However, the native pasture thistle is a favorite among insect pollinators. Similarly, rabbit tobacco has many medicinal properties but only a C-value of 2. Land managers should remember the intent of the tool when managing a preserve.
-

- Cirsium discolor aka pasture thistle
-

- Pseudognaphalium obtusifolium aka rabbit tobacco
At first, I didn’t like the idea of using a system created by western science to assign more “value” to one species than another. However, the more I used it, the more I began seeing it not as a standalone tool, but as a useful tool to connect people to a land’s story. Personally, stewardship to me is all about being in tune with the needs of the land. By paying attention to the plants in the present, it teaches us about the past while at the same time informing future work.
Interpreting the Numbers – Relating C-value to plant communities
Once C-values were assigned, I used those values, together with other information from my plant survey, the University of Michigan’s Michigan Flora database’s distribution data, the Michigan Natural Feature Inventory’s Natural Community Classifications and circa 1800 vegetation maps to relate my data to plant communities at Sharon Hills.
Ultimately, I calculated a Floristic Quality Index (FQI) score for some of the plant communities–like prairie, forest, and wetland–within Sharon Hills’ existing management areas. The table below is an example of data from my survey grouped into natural communities and showing a few of the metrics that come out of the FQA.
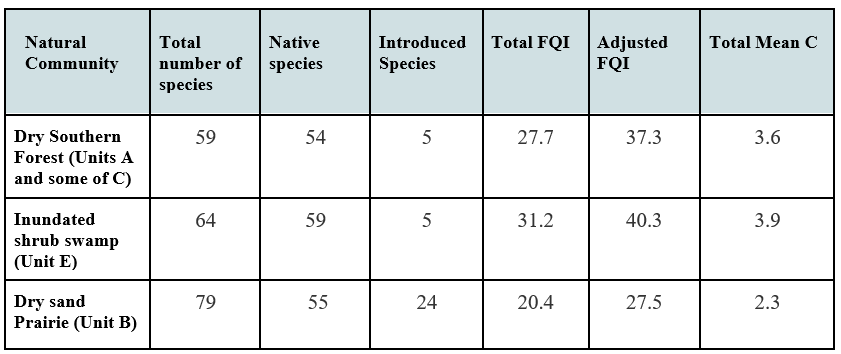
The Total FQI is calculated by multiplying the mean C-value by the square root of the total number of species. The Total Mean C is the average C-value for all the species (native and non-native). The Adjusted FQI is the FQI value without including non-native species.
For southeast Michigan, the Total FQI values observed in natural communities at Sharon Hills (27.7, 31.2, and 20.4) are pretty good! Most of Michigan’s remaining undeveloped lands will have an FQI less than 20. Areas with an FQI over 35 usually indicate that an area is floristically important to the state of Michigan.
Putting the Data to Work – Using analysis to create management units
This new information gathered during the analysis then helped me draft different management units for the Preserve, shown in the map below.
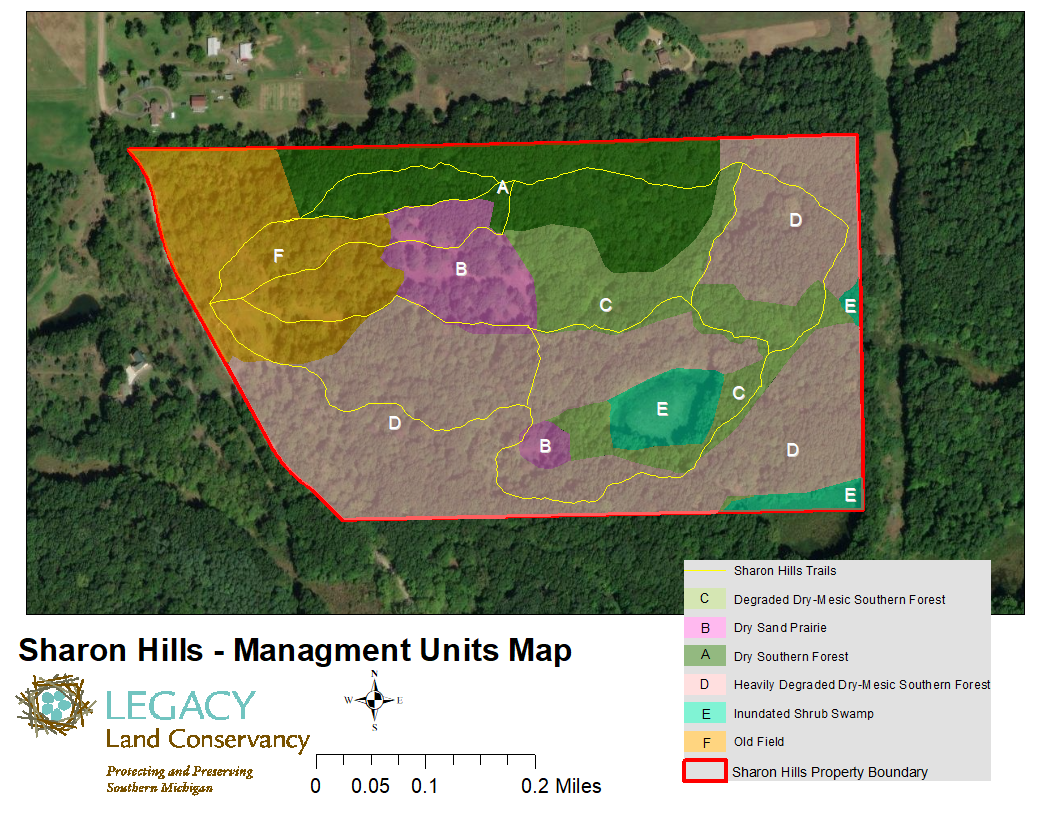
Updated management units created after the plant survey.
I spent most of the plant survey in units A, B, C, and E. Units A and C are both types of southern forest but differ in the amount of autumn olive (a woody invasive shrub) present in the understory. Dry-mesic and dry southern forest types often overlap with one another.
Sites are deemed “disturbed” when invasive plants, animals, or humans have or are actively disrupting the ecology (deforestation, dumping, etc.). However, disturbed sites are still an important part of a site’s overall management plan. It is the job of land stewards to treat symptoms of disturbance, such as invasive species, while shepherding in processes (such as prescribed fire) to bring back stronger and more resilient natural communities.
As my time with Legacy ends, I am proud the plant survey I completed has helped identify new, more ground-truthed management units at Sharon Hills that will eventually play a part in an updated management plan. Legacy anticipates the comprehensive plan should be ready and approved by early spring of 2024.
Sense of place at Legacy
Every second I spent out at Sharon Hills, I loved. Something about the land made me feel a sense of belonging and purpose. I loved how the plant survey allowed me to zone in on so many aspects of the preserve. It was a rewarding experience to analyze metrics to help steward this land, to pay respect to its history, and to play a role in its evolving ecology.
I know that with each year my botany skills will improve and so will my ability to listen to the natural world I seek to serve. I feel so grateful I was able to take time to observe and record the current Sharon Hills story during my time with Legacy. I know I’ll be back on the preserves as a longtime volunteer 😊